-
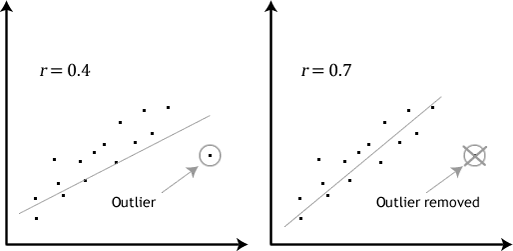
R squared dependency on sample’s mean makes it susceptible to extreme values (e.g. outliers) when measuring for linear regression or correlation
- This is because Pearson’s R measure distances of data points from its x-mean and y-mean – linearity and homoscedasticity assumption is critical

- Formula to find the Pearson correlation coefficient, denoted as R
- \[R_{xy}=\frac {\sum\limits_{i=1}^n(x_i-\bar{x})(y_i-\bar{y})} { \sqrt{\sum\limits_{i=i}^{n}(x_i-\bar{x})^2 } \sqrt{\sum\limits_{i=i}^{n}(y_i-\bar{y})^2 } }\]
- In the case where you do have outliers, the resultant R including them may mislead by either reducing the strength (when the outlier is off tangent), or improve it greatly (when outlier within the line but far off)
References
- Pearson Correlation Coefficient - Statology
- Pearson Coefficient of Correlation Explained / by Joseph Magiya / Towards Data Science
Metadata
- topic:: 00 Statistics00 Statistics
#MOC / Hub for notes related to general statistical knowledge
- updated:: 2022-09-10 Private or Broken Links
The page you're looking for is either not available or private!
- reviewed:: 2022-09-10 Private or Broken Links
The page you're looking for is either not available or private!
- #PermanentNote