Five-number summary help to give quick sense on data spread and skew
- Every distribution can be organized using a five-number summary:
- Lowest value
- Q1: 25th percentile
- Q2: the median
- Q3: 75th percentile
- Highest value (Q4)
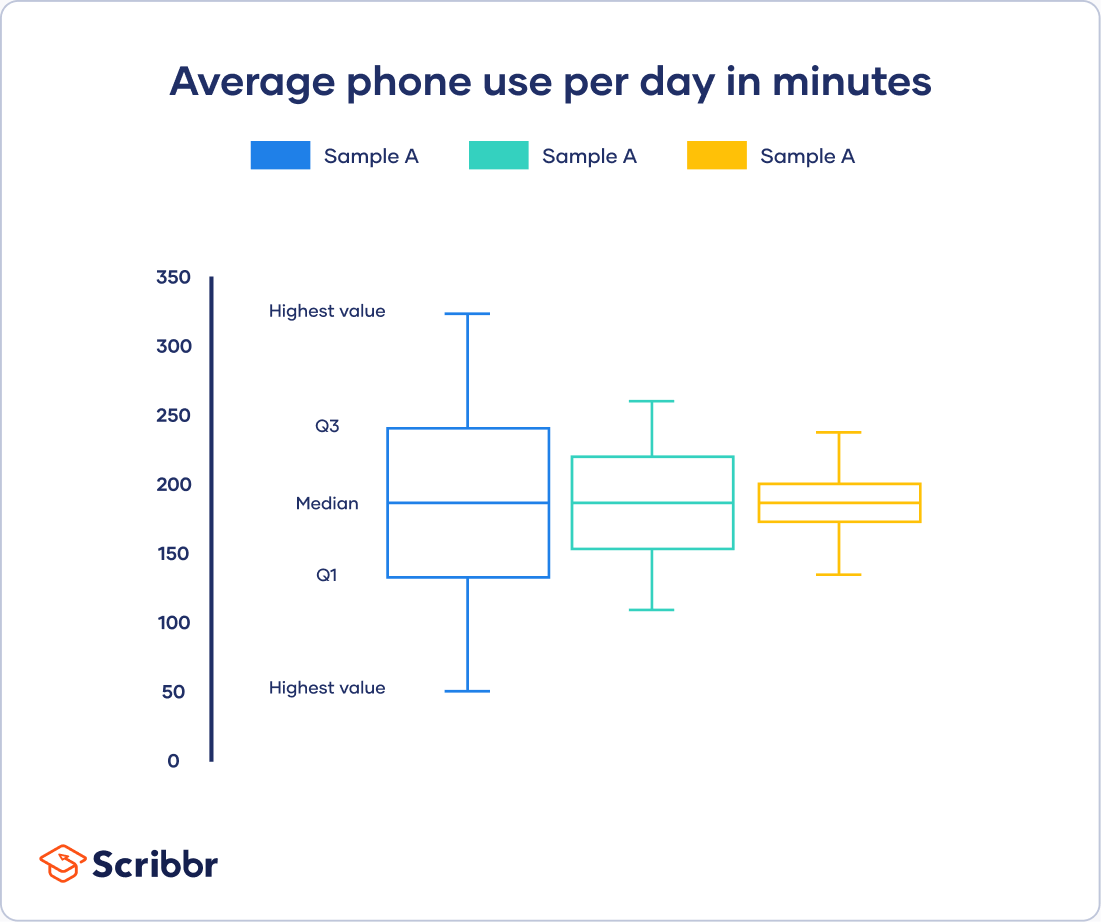
- These five-number summaries can be easily visualized using box and whisker plots.
- This help to get better understanding on the data, especially since Low variability gives better predictabilityLow variability gives better predictability
#FleetingNote
Why does variability matter?
While the central tendency, or average, tells you where most of your points lie, variability summarizes how far apart they are. This is important be... - For each of our samples, the horizontal lines in a box show Q1, the median and Q3, while the whiskers at the end show the highest and lowest values.
- This help to get better understanding on the data, especially since Low variability gives better predictabilityLow variability gives better predictability
References
- central tendency Private or Broken Links
The page you're looking for is either not available or private!
- Low variability gives better predictabilityLow variability gives better predictability
#FleetingNote
Why does variability matter?
While the central tendency, or average, tells you where most of your points lie, variability summarizes how far apart they are. This is important be...-
[Variability Calculating Range, IQR, Variance, Standard Deviation (scribbr.com)](https://www.scribbr.com/statistics/variability/)
-
Metadata
- topic:: 00 Statistics00 Statistics
#MOC / Hub for notes related to general statistical knowledge
- updated:: 2022-03-22 Private or Broken Links
The page you're looking for is either not available or private!
- reviewed:: 2022-03-22 Private or Broken Links
The page you're looking for is either not available or private!
- #PermanentNote