Examples below shows R code and functions since I use primarily R for data analysis. You can google for similar function in Python (or other data analysis tool)
-
Independence of observations (aka no autocorrelation)
- Use the
cor()function to test the relationship between your independent variables and make sure they aren’t too highly correlated. cor(heart.data$biking, heart.data$smoking)- When we run this code, the output is 0.015. The correlation between biking and smoking is small (0.015 is only a 1.5% correlation), so we can include both parameters in our model.
- Use the
-
Normality
- Use the
hist()function to test whether your dependent variable follows a normal distribution.- e.g.
hist(heart.data$heart.disease) 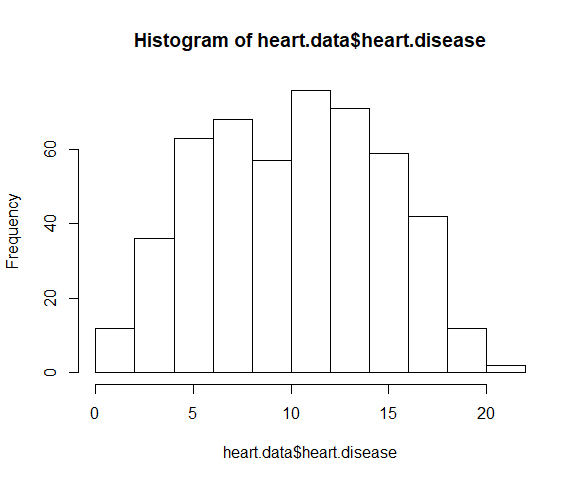
- e.g.
- The distribution of observations is roughly bell-shaped, so we can proceed with the linear regression.
- Use the
-
Linearity
- We can check this using two scatterplots: one for biking and heart disease, and one for smoking and heart disease.
- e.g.
plot(heart.disease ~ biking, data=heart.data) 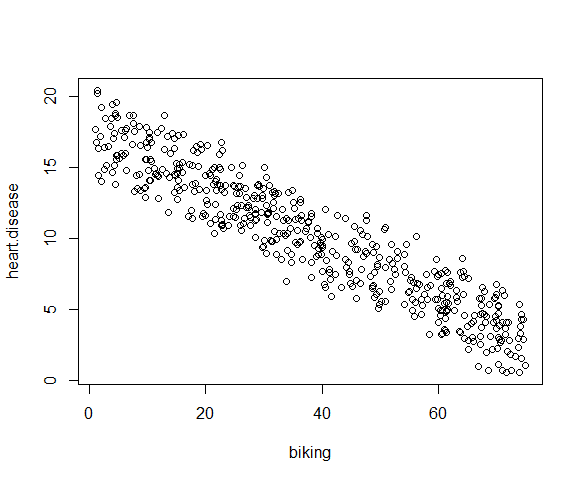
- e.g.
plot(heart.disease ~ smoking, data=heart.data) 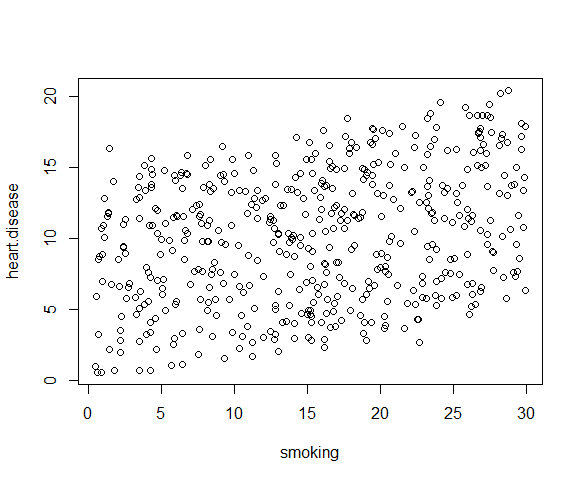
- e.g.
- Although the relationship between smoking and heart disease is a bit less clear, it still appears linear. We can proceed with linear regression.
- We can check this using two scatterplots: one for biking and heart disease, and one for smoking and heart disease.
-
Homoscedasticity
- We will check this after we make the model.
References
-
[Linear Regression in R An Easy Step-by-Step Guide (scribbr.com)](https://www.scribbr.com/statistics/linear-regression-in-r/)
Metadata
- topic:: 00 Statistics00 Statistics
#MOC / Hub for notes related to general statistical knowledge
- updated:: 2022-10-10 Private or Broken Links
The page you're looking for is either not available or private!
- reviewed:: 2022-10-10 Private or Broken Links
The page you're looking for is either not available or private!
- #Reference